System Monitoring with Sar

sar is part of the sysstat project, a suite of programs for system monitoring. With sar, we can log system activity, build performance reports and even make plots.
sar is available on Linux, Solaris, AIX and HP-UX.
We can choose to run sar automatically, as an unattended script. Or interactively and get system metrics on the spot.
Unattended Mode
With a simple cron entry we can log system activity. If possible, as root, otherwise some data may be missing.
# cron entries, take a sample every 10 minutes
@reboot /usr/lib/sa/sa1 --boot
*/10 * * * * /usr/lib/sa/sa1 1 1 -S DISK
The @reboot line is kind of optional, but if the cron supports it’s good to have since it ensures the counters are reset
on boot.
sa1 is script that calls sadc, which does the actual collection.
To prevent the files from growing too large not everything is stored, however
additional counters can be enabled with -S.
Optional collection options for sadc:
- DISK block devices
- XDISK block devices and partitions
- INT system interrupts
- IPV6 network IPV6 statistics
- POWER power management
- SNMP is for the SNMP statistics
- ALL everything except XDISK
- XALL everthing including XDISK
Also check sysstat’s config for compression and retention options. /etc/conf.d/sysstat or /etc/default/sysstat
To access the stored data we have two alternatives:
sa2 is a script that generates an activity report for the previous day (/var/log/sarNN). This can be croned easily:
# generate daily activity report
00 18 * * * /usr/lib/sa/sa2 -A
The other way is calling sar directly, this lets us choose the view:
# sar views with extended options
-u [ALL]  CPU utilization (default view)
-b        I/O rates
-d        block device activity
-F        mounted filesystem statistics
-n ALL    network statistics
-P ALL    per processor statistics
-q        queue and load average
-r [ALL]  memory utilization
-H        hugepages utilization
-S        swap space utilization
-B        paging statistics
-W        swapping activity
-v        inode and kernel tables
-w        task/process creation
-y        TTY device activity
-m ALL    power management statistics
-I ALL    interrupts
-A        Everything
Some views have additional options, for example -n ALL shows all network activity (including protocols) while -n DEV
only shows network devices.
sar by default shows today’s logs, -1 brings yesterday’s, -2 the day before yesterday and so on.
We can specify the day’s starting -s and end times -e in HH:MM:SS format
# yesterday's cpu report, with start and end time
sar -1 -s 2:58:05 -e 2:58:55
Linux 4.19.8-arch1-1-ARCH (ix) 	12/26/2018 	_x86_64_	(4 CPU)

02:58:05 PM     CPU     %user     %nice   %system   %iowait    %steal     %idle
02:58:10 PM     all     10.89      0.00      7.82      0.00      0.00     81.29
02:58:15 PM     all      9.82      0.00      7.35      0.00      0.00     82.83
02:58:20 PM     all     11.28      0.00      6.33      0.05      0.00     82.34
02:58:25 PM     all     10.69      0.00      7.06      0.05      0.00     82.21
02:58:30 PM     all     10.27      0.00      7.02      0.00      0.00     82.71
02:58:35 PM     all     11.49      0.00      8.22      0.00      0.00     80.30
02:58:40 PM     all     11.90      0.00      6.66      0.05      0.00     81.39
02:58:45 PM     all     14.38      0.00      7.14      0.05      0.00     78.43
02:58:50 PM     all     10.66      0.00      6.63      0.00      0.00     82.71
02:58:55 PM     all     15.01      0.00      6.63      0.00      0.00     78.35
Average:        all     11.63      0.00      7.09      0.02      0.00     81.26
Interactive Sar
A quicker alternative is running sar interactively. We can log system activity while doing some other tasks. Perhaps while running a benchmark or doing some troubleshooting.
With the -o option, sar stores/appends data in a file or directory.
sar takes a sample interval (in seconds) and count that works as a stop condition.
# collect activity in my_metrics file, 1 sample per second, 60 samples total
sar -o my_metrics 1 60
Linux 4.19.8-arch1-1-ARCH (ix) 	12/24/2018 	_x86_64_	(4 CPU)

07:01:06 PM     CPU     %user     %nice   %system   %iowait    %steal     %idle
07:01:07 PM     all     11.08      0.00      4.79      0.00      0.00     84.13
07:01:08 PM     all     13.71      0.00      7.11      0.25      0.00     78.93
07:01:09 PM     all     13.62      0.00      6.43      0.00      0.00     79.95
07:01:10 PM     all     13.99      0.00      6.36      0.00      0.00     79.64
...
If you’ve used mpstat before, you’ll recognize the format, it’s exactly the same.
To retrieve the results we use -f.
We can use a different interval or count and the output will be filtered appropiately.
# print report from my_metrics file
sar -f my_metrics -s 14:00:00 1 5
Linux 4.19.8-arch1-1-ARCH (ix) 	12/24/2018 	_x86_64_	(4 CPU)

14:00:00 PM     CPU     %user     %nice   %system   %iowait    %steal     %idle
14:00:01 PM     all      9.47      0.00      6.01      0.00      0.00     84.52
14:00:02 PM     all     11.11      0.00      5.05      0.00      0.00     83.84
14:00:03 PM     all     29.62      0.00      9.87      0.00      0.00     60.51
14:00:04 PM     all     12.85      0.00      3.27      0.00      0.00     83.88
14:00:05 PM     all     20.00      0.00      8.86      0.00      0.00     71.14
Average:        all     16.09      0.00      6.57      0.00      0.00     77.35
# print memory activity from my_metrics file
sar -r -f my_metrics
Linux 4.19.8-arch1-1-ARCH (ix) 	12/24/2018 	_x86_64_	(4 CPU)

07:45:47 PM kbmemfree   kbavail kbmemused  %memused kbbuffers  kbcached  kbcommit   %commit  kbactive   kbinact   kbdirty
07:45:48 PM    755544   5216144   5525576     47.27    876804   3773928  14648100     83.48   7714540   2267792      4404
07:45:49 PM    753728   5214328   5527772     47.29    876804   3773548  14648100     83.48   7716816   2267400      4420
07:45:50 PM    734512   5195136   5546088     47.45    876804   3774448  14651412     83.49   7734560   2268308      4432
07:45:51 PM    717524   5178164   5562876     47.59    876804   3774648  14670976     83.61   7750836   2268504      4448
07:45:52 PM    711580   5172232   5568900     47.65    876804   3774568  14670976     83.61   7757748   2268428      4460
Average:       734578   5195201   5546242     47.45    876804   3774228  14657913     83.53   7734900   2268086      4433
Exporting Sar’s Data
Wouldn’t it be great to be able to export the collected data? Maybe to a database or a spreasheet?
Don’t we deserve some nice plots? No worries, sadf has us covered.
sadf syntax is a bit quirkier:
sadf [options] [ <interval> [ <count> ] ] [ <datafile> | -[0-9]+ ] -- [sar options]

  options:
    -p table
    -d CSV
    -r raw CSV (as read from the kernel)
    -x XML
    -d JSON
    -g SVG
The options to the right of the -- are sent to sar for printing the report, here we can choose what views to export.
To select the log file we can use either 0, -1, etc for daily logs (as in the unattended mode) or just
provide the path to the datafile.
# export yesterday's I/O activity in CSV
sadf -d -1  -- -b
# hostname;interval;timestamp;tps;rtps;wtps;bread/s;bwrtn/s
ix;1;2018-12-26 17:58:06 UTC;20.00;0.00;20.00;0.00;168.00
ix;1;2018-12-26 17:58:07 UTC;0.00;0.00;0.00;0.00;0.00
ix;1;2018-12-26 17:58:08 UTC;0.00;0.00;0.00;0.00;0.00
ix;1;2018-12-26 17:58:09 UTC;71.00;0.00;71.00;0.00;624.00
...
# export CPU activity from my_metrics file in JSON
sadf -j my_metrics -- -u
{"sysstat": {
        "hosts": [
                {
                        "nodename": "ix",
                        "sysname": "Linux",
                        "release": "4.19.8-arch1-1-ARCH",
                        "machine": "x86_64",
                        "number-of-cpus": 4,
                        "file-date": "2018-12-26",
                        "file-utc-time": "17:58:05",
                        "statistics": [
                                {
                                        "timestamp": {"date": "2018-12-26", "time": "17:58:06", "utc": 1, "interval": 1},
                                        "cpu-load": [
                                                {"cpu": "all", "user": 16.11, "nice": 0.00, "system": 10.58, "iowait": 0.00, "steal": 0.00, "idle": 73.32}
                                        ]
                                },
...
With -g we get SVG output that we can redirect into a file.
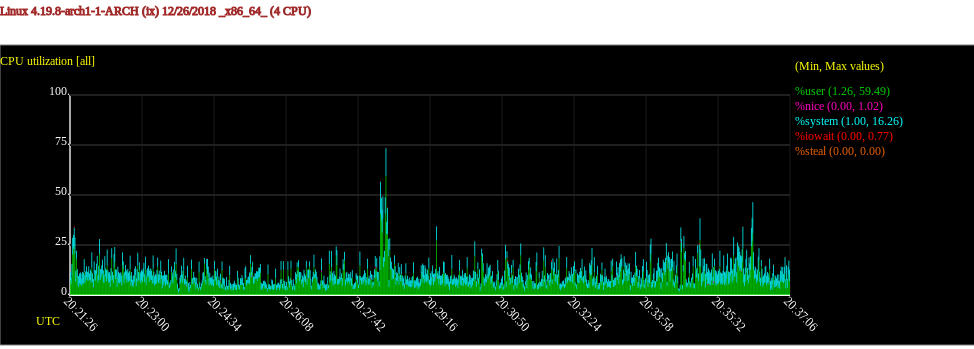
# export CPU activity as SVG plot
sadf -g -- -u > cpu.svg
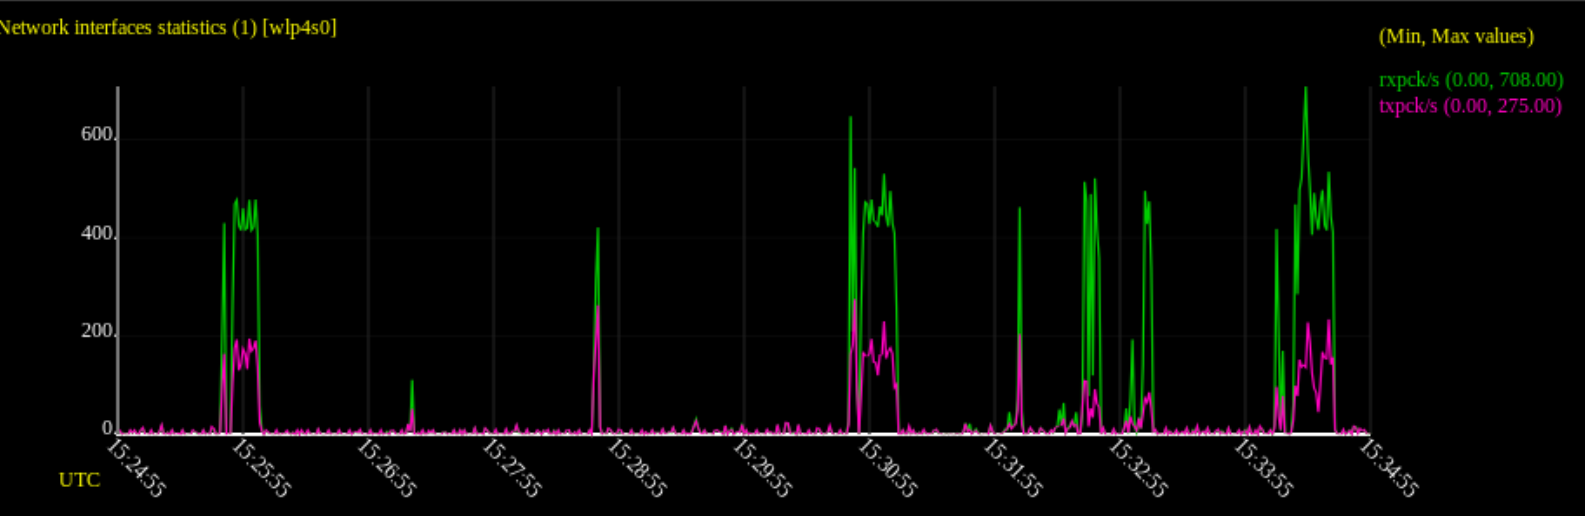
# export network activity for device eth0 as SVG plot
sadf -g  -- -n DEV --iface=eth0 > a.svg
Related Links
- sysstat website: http://pagesperso-orange.fr/sebastien.godard
- sysstat github: https://github.com/sysstat/sysstat
- manpages
Wrapping Up
For sure, there are a lot of more options available, I just can’t cover them all, but I think the basics were covered.
That’s all for now. If interested on system monitoring, sure to check my previous article about vmstat.
Have a good one.
Tomas